|
ACI.dev: The Only MCP Server Your AI Agents Need (Sponsored)
 |
ACI.dev’s Unified MCP Server provides every API your AI agents will need through just one MCP server and two functions. One connection unlocks 600+ integrations with built-in multi-tenant auth and natural-language permission scopes.
Plug & Play – Framework-agnostic, works with any architecture.
Secure – Tenant isolation for your agent’s end users.
Smart – Dynamic intent search finds the right function for each task.
Reliable – Sub-API permission boundaries to improve agent reliability.
Fully Open Source – Backend, dev portal, library, MCP server implementation.
Skip months of infra plumbing; ship the agent features that matter.
Disclaimer: The details in this post have been derived from the articles written by the Canva engineering team. All credit for the technical details goes to the Canva Engineering Team. The links to the original articles and videos are present in the references section at the end of the post. We’ve attempted to analyze the details and provide our input about them. If you find any inaccuracies or omissions, please leave a comment, and we will do our best to fix them.
Every product team wants data. Not just numbers, but sharp, trustworthy, real-time answers to questions like: Did this new feature improve engagement? Are users abandoning the funnel? What’s trending right now?
However, collecting meaningful analytics at scale is less about dashboards and more about plumbing.
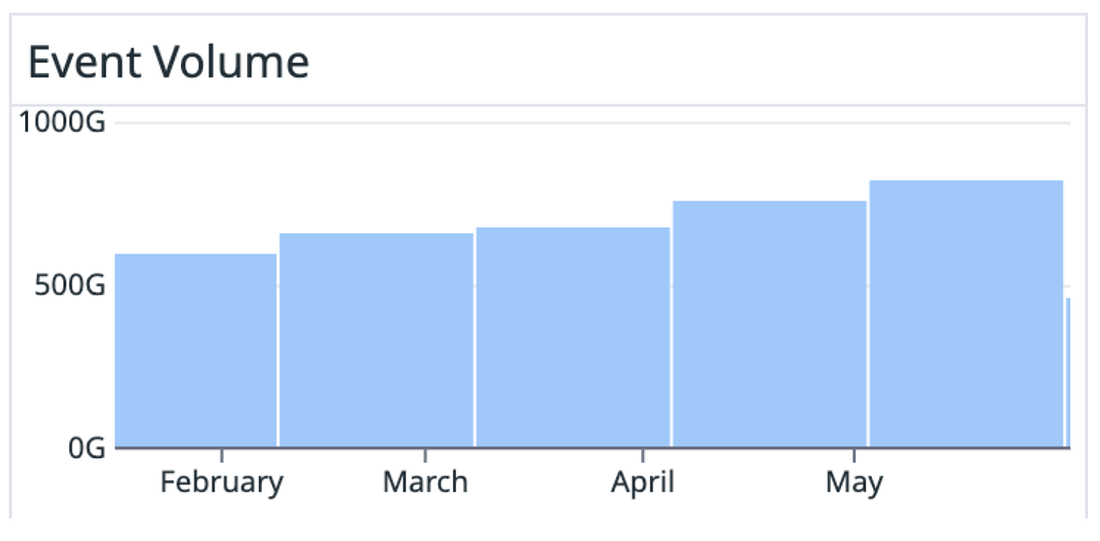
At Canva, analytics isn’t just a tool for dashboards but a part of the core infrastructure. Every design viewed, button clicked, or page loaded gets translated into an event. Multiply that across hundreds of features and millions of users, and it becomes a firehose: 25 billion events every day, flowing with five nines of uptime.
 |
Achieving that kind of scale requires deliberate design choices: strict schema governance, batch compression, fallback queues, and a router architecture that separates ingestion from delivery.
This article walks through how Canva structures, collects, and distributes billions of events daily, without drowning in tech debt and increasing cloud bills.
Their system is organized into three core stages:
Structure: Define strict schemas
Collect: Ingest and enrich events
Distribute: Route events to appropriate destinations
Let’s each look at each stage in detail.
Structure
Most analytics pipelines start with implementation speed in mind, resulting in undocumented types and incompatible formats. It works until someone asks why this metric dropped, and there is no satisfactory answer.
Canva avoided that trap by locking down its analytics schema from day one. Every event, from a page view to a template click, flows through a strictly defined Protobuf schema.
Instead of treating schemas as an afterthought, Canva treats them like long-term contracts. Every analytics event must conform to a Protobuf schema that guarantees full transitive compatibility:
Forward-compatible: New consumers must handle events created by old clients.
Backward-compatible: Old consumers must handle events from new clients.
Breaking changes like removing a required field or changing types aren’t allowed. If something needs to change fundamentally, engineers ship an entirely new schema version. This keeps years of historical data accessible and analytics queries future-proof.
To enforce these schema rules automatically, Canva built Datumgen: a layer on top of protoc that goes beyond standard code generation.
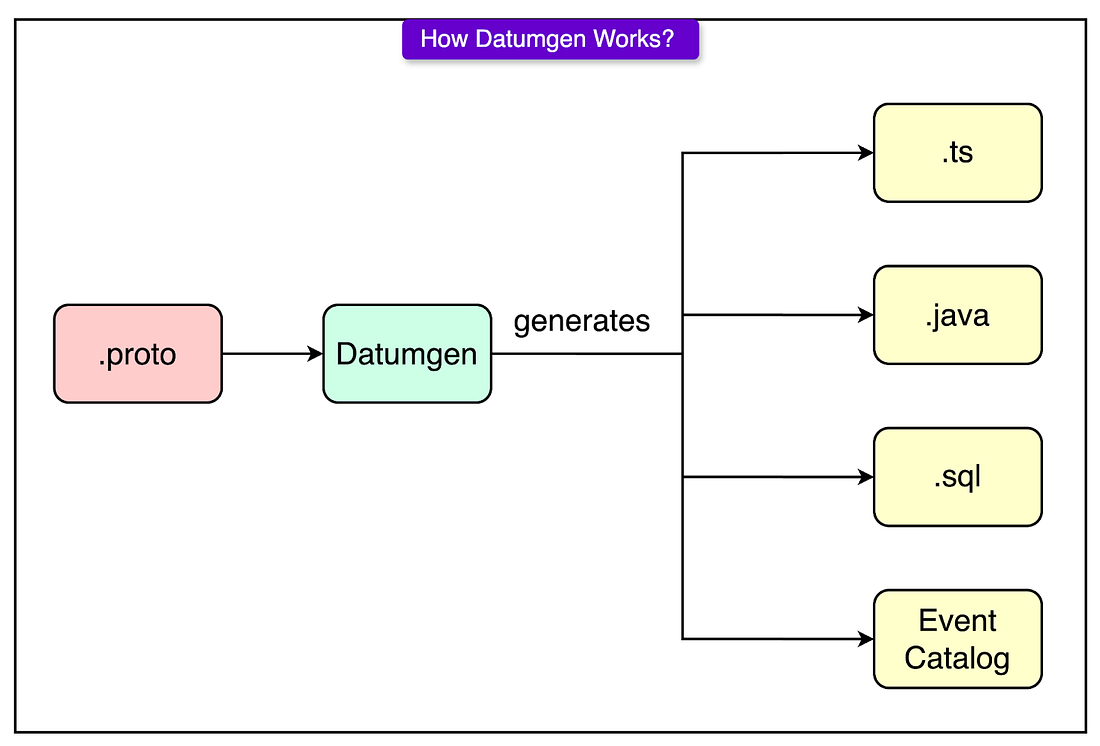 |
Datumgen handles various components like:
TypeScript definitions for frontends, ensuring events are type-checked at compile time.
Java definitions for backend services that produce or consume analytics.
SQL schemas for Snowflake, so the data warehouse always knows the shape of incoming data.
A live Event Catalog UI that anyone at Canva can browse to see what events exist, what fields they contain, and where they’re routed.
Every event schema must list two human owners:
A Technical Owner: Usually the engineer who wrote the event logic.
A Business Owner: Often a data scientist who knows how the event maps to product behavior.
Fields must also include clear, human-written comments that explain what they mean and why they matter. These aren’t just helpful for teammates. They directly power the documentation shown in Snowflake and the Event Catalog.
Collect
The biggest challenge with analytics pipelines isn’t collecting one event, but collecting billions, across browsers, devices, and flaky networks, without turning the ingestion service into a bottleneck or a brittle mess of platform-specific hacks.
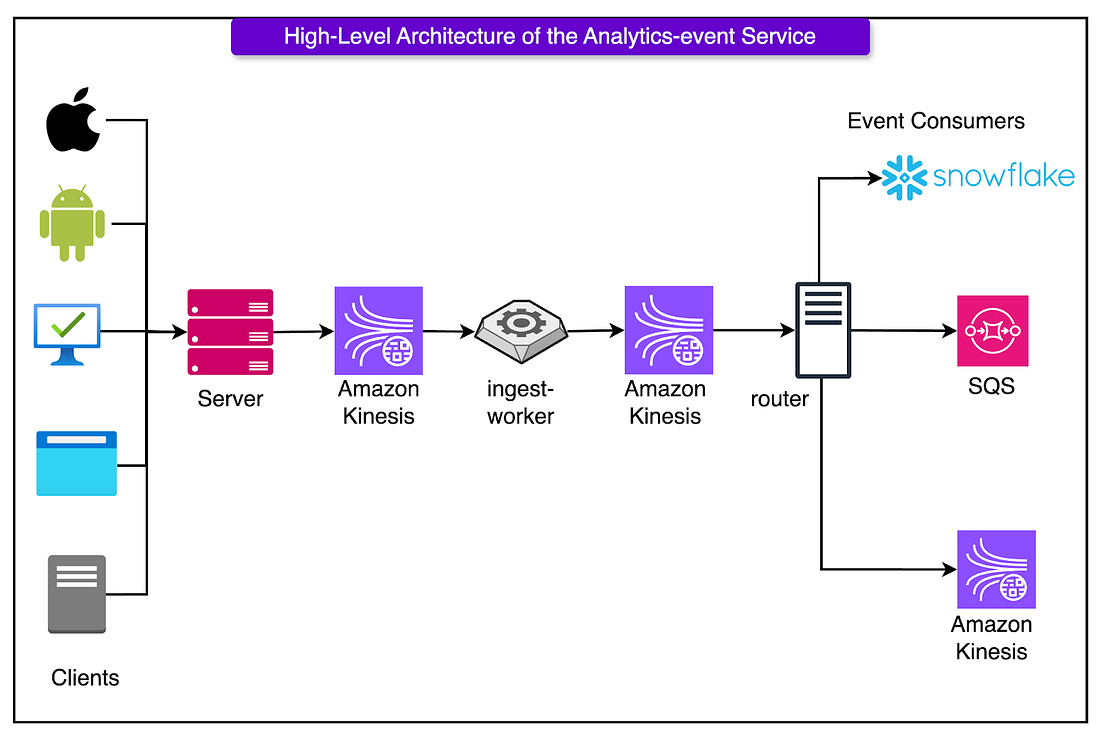
Canva’s ingestion layer solves this by betting on two things: a unified client and an asynchronous, AWS Kinesis-backed enrichment pipeline. Rather than building (and maintaining) separate analytics SDKs for iOS, Android, and web, Canva went the other way: every frontend platform uses the same TypeScript analytics client, running inside a WebView shell.
 |
Only a thin native layer is used to grab platform-specific metadata like device type or OS version. Everything else, from event