Dear Educator,
At CFR Education, we recognize that there are diverse learning styles and tailor our resources to specifically meet those needs. One style of learning that CFR Education resources specifically address is visual learning.
We integrate visualization into our resources to make complex ideas accessible, memorable, and impactful because the right chart in the right place can reveal insights beyond text alone.
Keep reading to learn how CFR Education uses visuals to make learning more accessible, including for topics such as:
Whether highlighting scale, illustrating trends over time, or visualizing nuanced concepts such as territorial disputes, our visual tools are designed to support learning and spark curiosity. Happy learning,
Caroline Netchvolodoff Vice President, Education
Council on Foreign Relations |
| |
Teaching History with Maps |
Maps are invaluable teaching tools. By offering powerful visual representations, they immediately frame complex situations for students. Nothing can clarify a territorial debate or illustrate power dynamics quite like a map. They also serve a vital role in helping students visualize and understand the world beyond their immediate surroundings.
Below are two examples of how maps can help you teach about important yet complicated historical conflicts. |
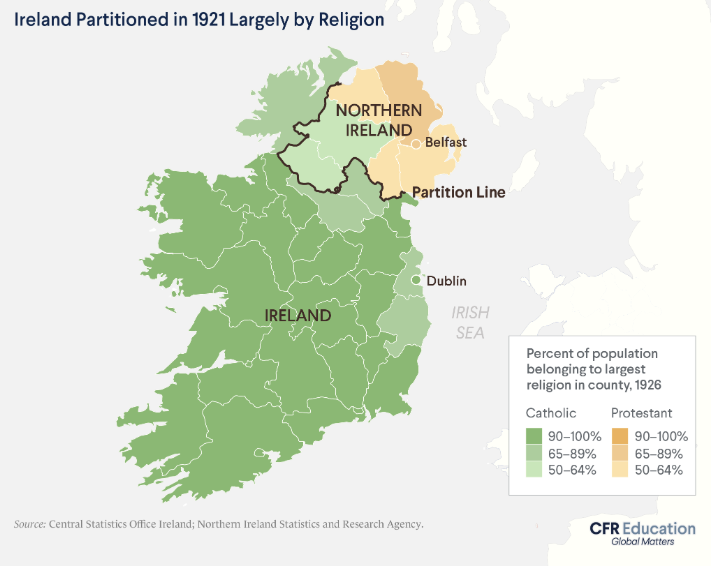
When it comes to the Troubles, the deadly conflict that engulfed Northern Ireland from the 1960s to the late 1990s, looking at a map is essential.
The Troubles’ seeds were planted centuries ago when British Protestants first subjugated Ireland’s native Catholic population. When the Republic of Ireland received independence in the early 1920s, the line between it and the United Kingdom was based on religion.
As your students will see in the map, Catholics were still living on the U.K. side of the partition line and they quickly began to express frustration over issues like unequal access to housing and jobs. Soon after, the disagreements over religion and political allegiance led to armed conflict. The visuals in this resource help students better understand the lived impact of the partition line in ways that just reading about the demographic differences might not. |
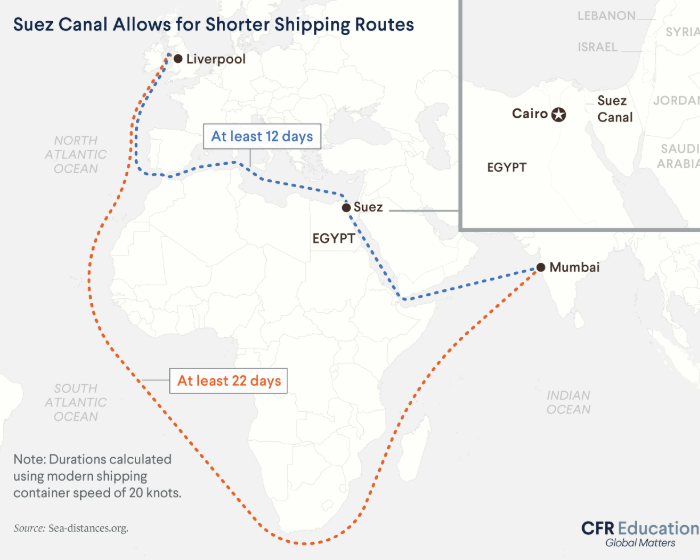
Nationalizing the Suez Canal |
In 1956, Egypt nationalized the Suez Canal, which had previously been under joint British and French management. This action promptly led to an invasion of Egypt by a coordinated force of Britain, France, and Israel.
The United States, in the midst of the Cold War, feared the invasion would push Egypt closer to the Soviet Union and forced Britain, France, and Israel to withdraw.
Why did all these powerful countries care about a canal in faraway Egypt? As the map shows, the Suez Canal is a vital passageway for international trade. |
|
|
Educator tip: The Suez Canal Crisis is also a historical case study on how monetary policy can be used as a tool of foreign policy. Use this short video to explain how. |
|
|
Asking students to look at data and analyze it allows them to draw their own conclusions rather than relying on what you, as the educator, tell them.
Charts and graphs like the ones below can explain trends that are often hard to visualize. |
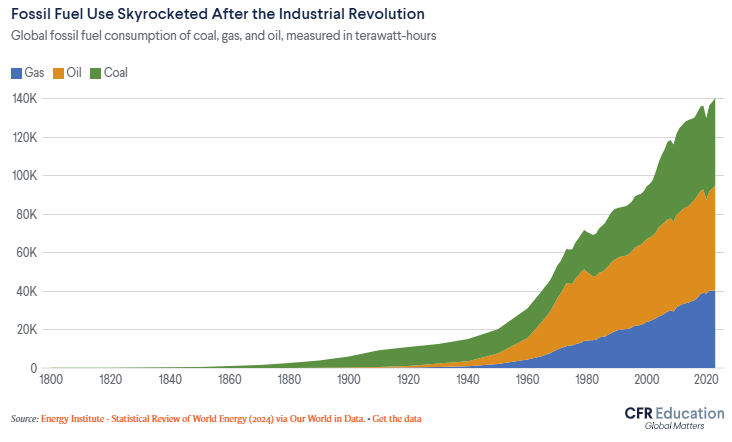
The World's Fossil Fuel Problem |
Is it true that humans cause climate change? Data from the Industrial Revolution can help students draw their own conclusions.
When new manufacturing processes and machines, like the steam engine, arrived on the scene, they needed to be powered by something. Coal became the go-to resource due to its high energy concentration and accessibility. This set off a chain reaction, and fossil fuels—coal, oil, and natural gas—were needed to power everything. Fossil fuels release CO2 into the atmosphere, and the CO2 then traps heat from the sun in the atmosphere, making the earth warmer.
While words can explain this trend, a graph like this one allows students to see the data and trends with their own eyes. |
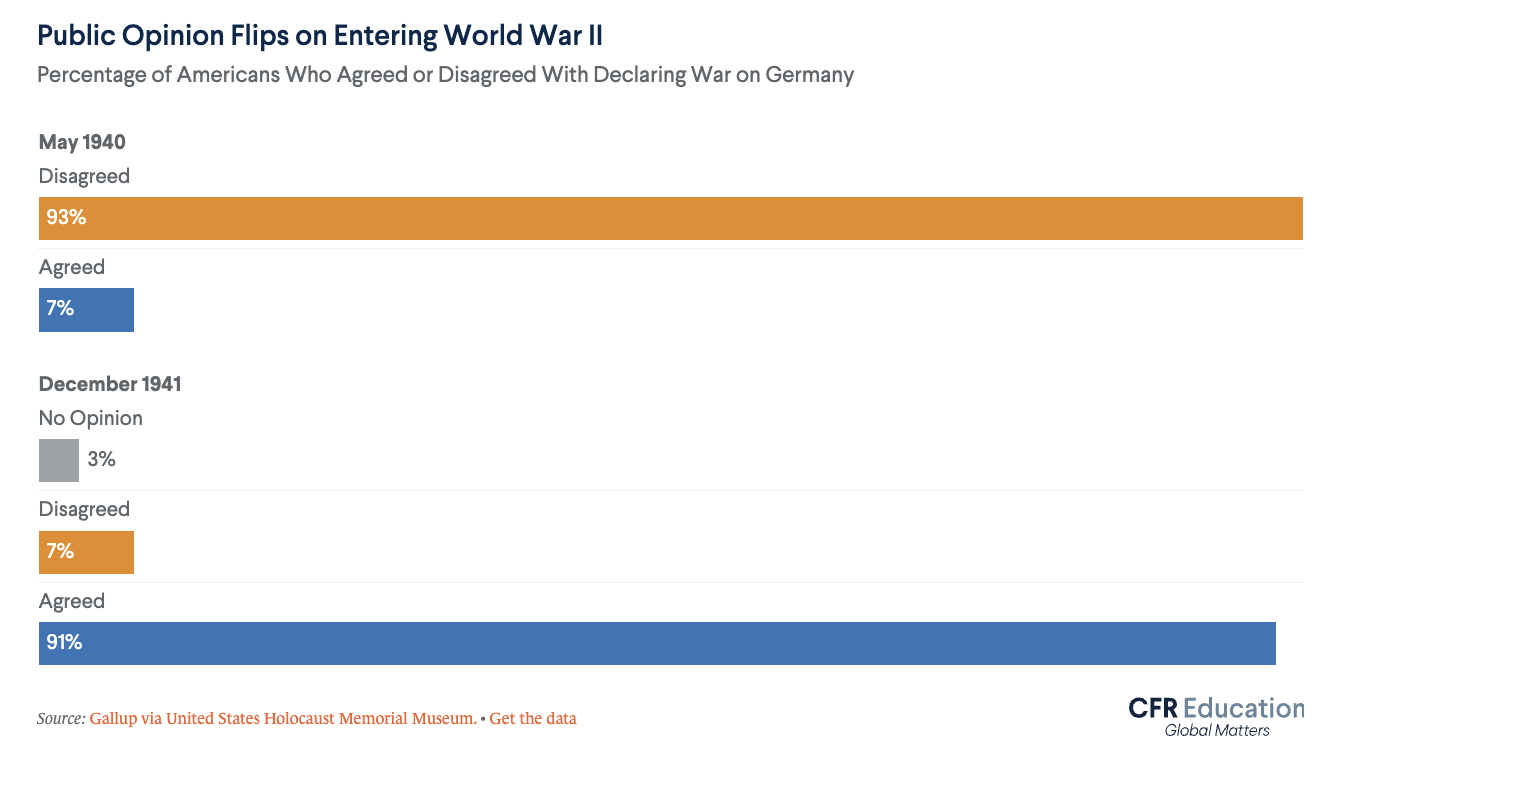
America’s Reluctance to Enter World War II |
A question that often comes up in class when teaching about World War II is why the U.S. didn't get involved in the beginning. In November 1941, Germany and its allies were on the brink of winning the war, controlling most of continental Europe, and the U.S. government was still refusing to join.
This bar chart emphasizes that not only was the U.S. government taking an isolationist stance, but American citizens were extremely against the war. It also shows that something changed in the minds of the American people. Can your students guess what caused such a shift? |
|
|
Council on Foreign Relations. All rights reserved. |
58 East 68th Street, New York, NY 10065 1777 F Street, NW, Washington, DC 20006 |
|
|
|