Asian American and Pacific Islander Heritage Month: May 2026
In 1992, Congress established May as Asian American and Pacific Islander Heritage Month to coincide with two key milestones: the arrival of the nation’s first Japanese immigrants (May 7, 1843) and Chinese workers’ pivotal role in building the transcontinental railroad (completed May 10, 1869). The move expanded what had been Asian/Pacific American Heritage Week since 1978. In 2021, a presidential proclamation broadened it to include Native Hawaiians. This Facts for Features includes separate sections on the Asian and the Native Hawaiian and Pacific Islander populations, which the Office of Management and Budget in 1997 split into two race categories.
The following facts are possible thanks to the invaluable responses to U.S. Census Bureau surveys. We appreciate the public’s cooperation as we measure America’s people, places and economy.
Asian Population
Did You Know?
26.8 million
The estimated number of Asian alone-or-in-combination residents in the United States in 2024. Source: 2024 Population Estimates
5.8 million
The estimated number of people of Chinese (except Taiwanese) descent in the United States in 2024. The Chinese (except Taiwanese) population was the largest Asian group, followed by Asian Indian (5.6 million), Filipino (5.0 million), Vietnamese (2.4 million), Korean (2.2 million) and Japanese (1.7 million). These estimates represent individuals who reported a specific detailed Asian group alone as well as those who reported that detailed Asian group in combination with one or more other detailed Asian groups or other race(s). Source: 2024 American Community Survey 1-year estimates
2.4%
The share of the Asian alone-or-in-combination population in 2024 who were military veterans. Source: 2024 American Community Survey 1-year estimates
57.7%
The share of the Asian alone-or-in-combination population age 25 and over who had a bachelor’s degree or higher in 2024. Source: 2024 American Community Survey 1-year estimates
89.7%
The share of the Asian alone or in combination population age 25 and over who had at least a high school diploma or equivalency in 2024. Source: 2024 American Community Survey 1-year estimates
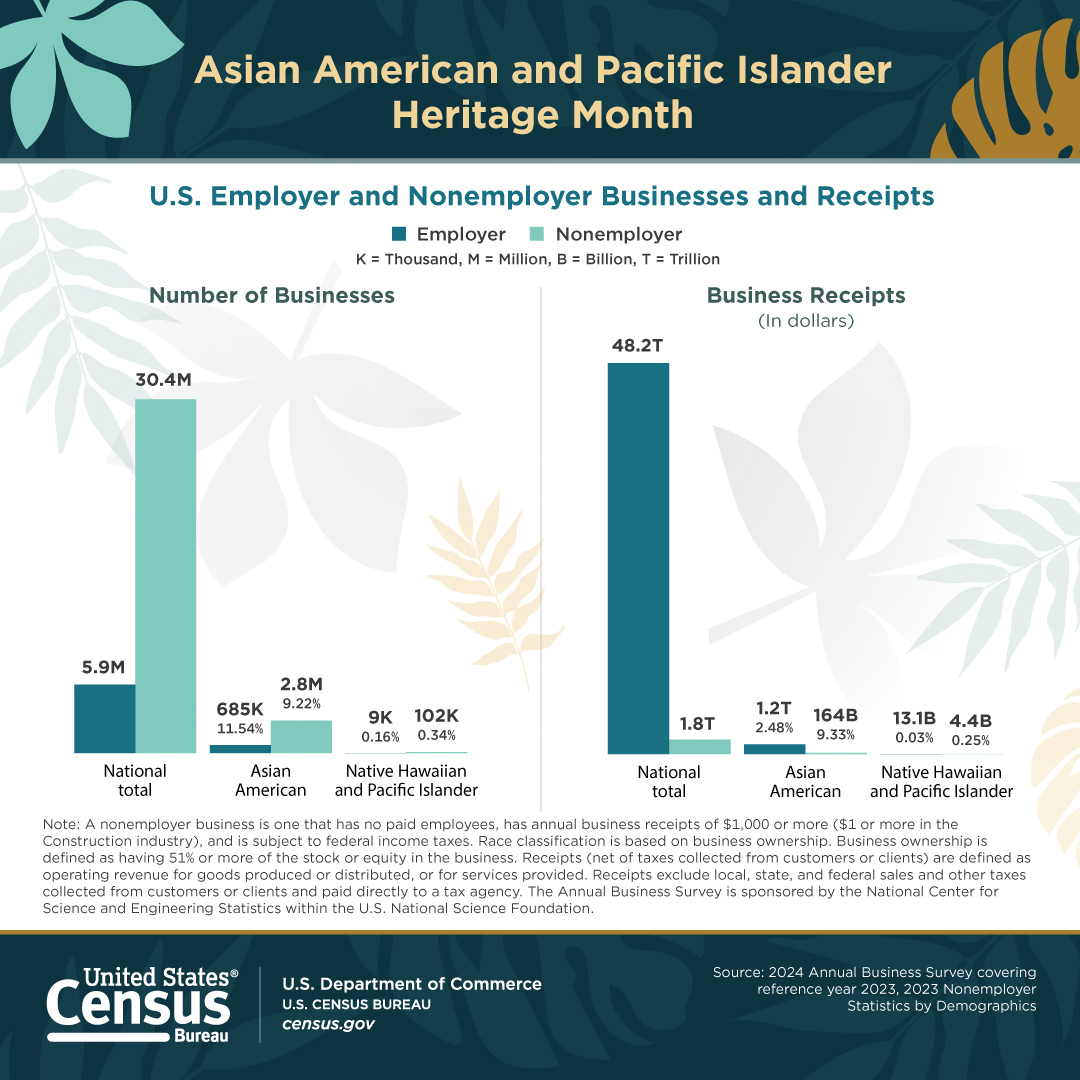
684,916
The estimated number of Asian-owned firms with paid employees in the United States in 2023. Source: 2024 Annual Business Survey (data year 2023)
Voting Rates
More Stats
A selected population profile of the Asian alone-or-in-combination population from the 2024 American Community Survey is available including statistics such as:
- Sex and age.
- Marital status.
- Employment status.
- Occupation.
- Commuting.
- Housing characteristics.
- Income.
Native Hawaiian and Pacific Islander Population
Did You Know?
1.8 million
The estimated number of Native Hawaiian and Pacific Islander (NHPI) alone-or-in-combination residents of the United States in 2024. Source: 2024 Population Estimates
728,718
The estimated number of Native Hawaiian residents of the United States in 2024. The Native Hawaiian population was the largest detailed NHPI group, followed by Samoan (271,387) and Chamorro (167,504). These estimates represent the number of people who reported a specific detailed NHPI group alone as well as those who reported that detailed NHPI group in combination with one or more other detailed NHPI groups or other race(s). Source: 2024 American Community Survey 1-year estimates
6.8%
The share of the Native Hawaiian and Pacific Islander alone-or-in-combination population in 2024 who were military veterans. Source: 2024 American Community Survey 1-year estimates
26.5%
The share of the Native Hawaiian and Pacific Islander alone-or-in-combination population age 25 and over in 2024 who had a bachelor’s degree or higher. Source: 2024 American Community Survey 1-year estimates
90.0%
The share of the Native Hawaiian and Pacific Islander alone-or-in-combination population age 25 and over in 2024 who had at least a high school diploma or equivalency. Source: 2024 American Community Survey 1-year estimates
9,413
The estimated number of Native Hawaiian and Pacific Islander-owned U.S. firms with paid employees in 2023. Source: 2024 Annual Business Survey (data year 2023)
More Stats
A selected population profile of the Native Hawaiian and Pacific Islander alone-or-in-combination population from the 2024 American Community Survey is available including statistics such as:
- Sex and age.
- Marital status.
- Employment status.
- Occupation.
- Commuting.
- Housing characteristics.
- Income.
|