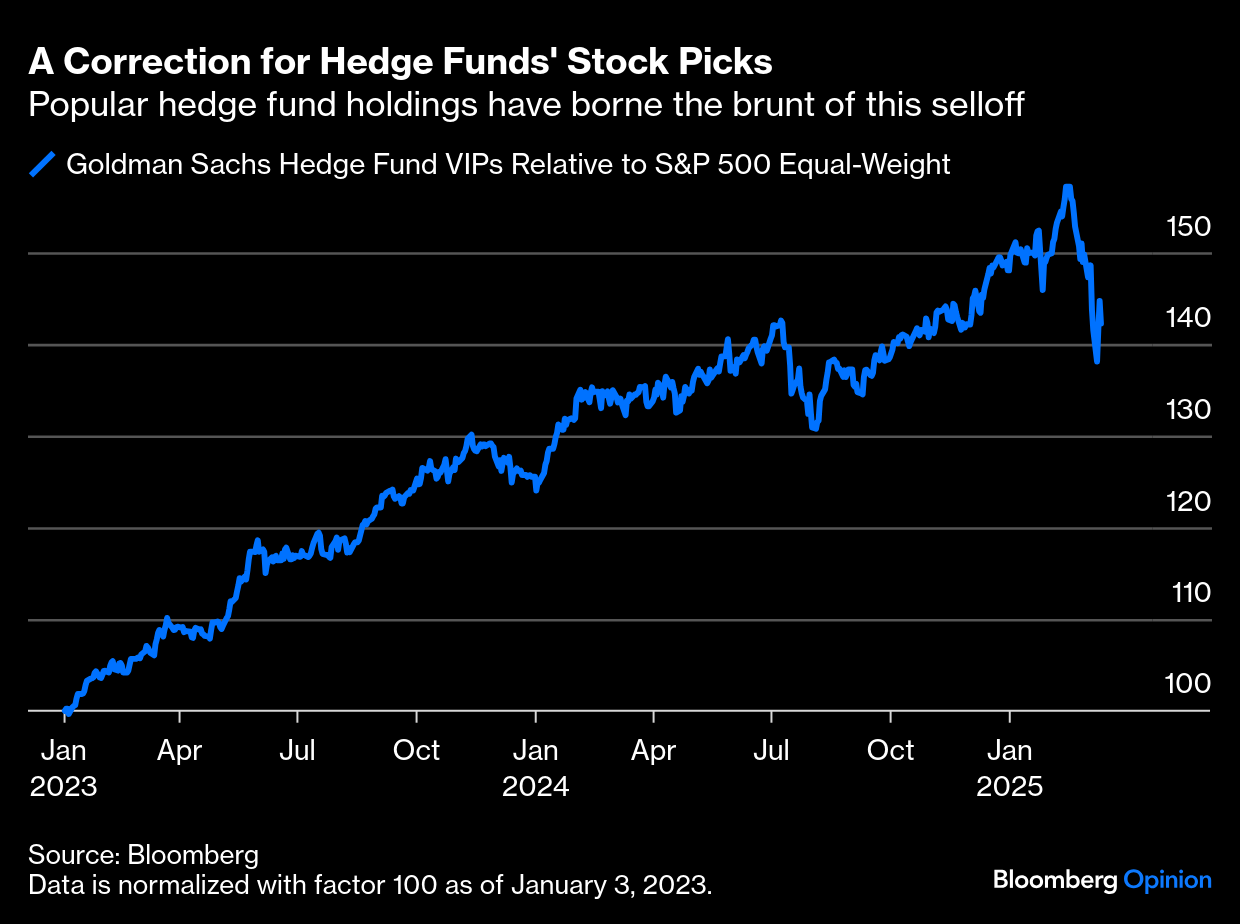
Marking Strategists to Market | As 2025 started — only 10 weeks ago — optimism for US stocks reigned. That was enshrined in Wall Street strategists’ targets for the S&P 500 by year-end, as regularly surveyed for many years by Bloomberg News colleague Lu Wang. They expected the S&P to reach 6,614 by Dec. 31, a gain of 12%. By February, these forecasts had barely moved. But since then, the S&P 500 has sold off. As of Thursday, it had dropped by more than 10% from its high set only three weeks ago, satisfying the popular definition of a “correction.” From here, it will need to rally by 20% (meeting the popular definition of a new bull market) to reach the target of 6,614. The strategists’ targets have suddenly grown to look very optimistic. Until such time as they’re revised, they imply the greatest bullishness in the last 10 years. This is how the average estimate, as compiled by Lu Wang, has moved compared to the S&P 500 itself over that time: 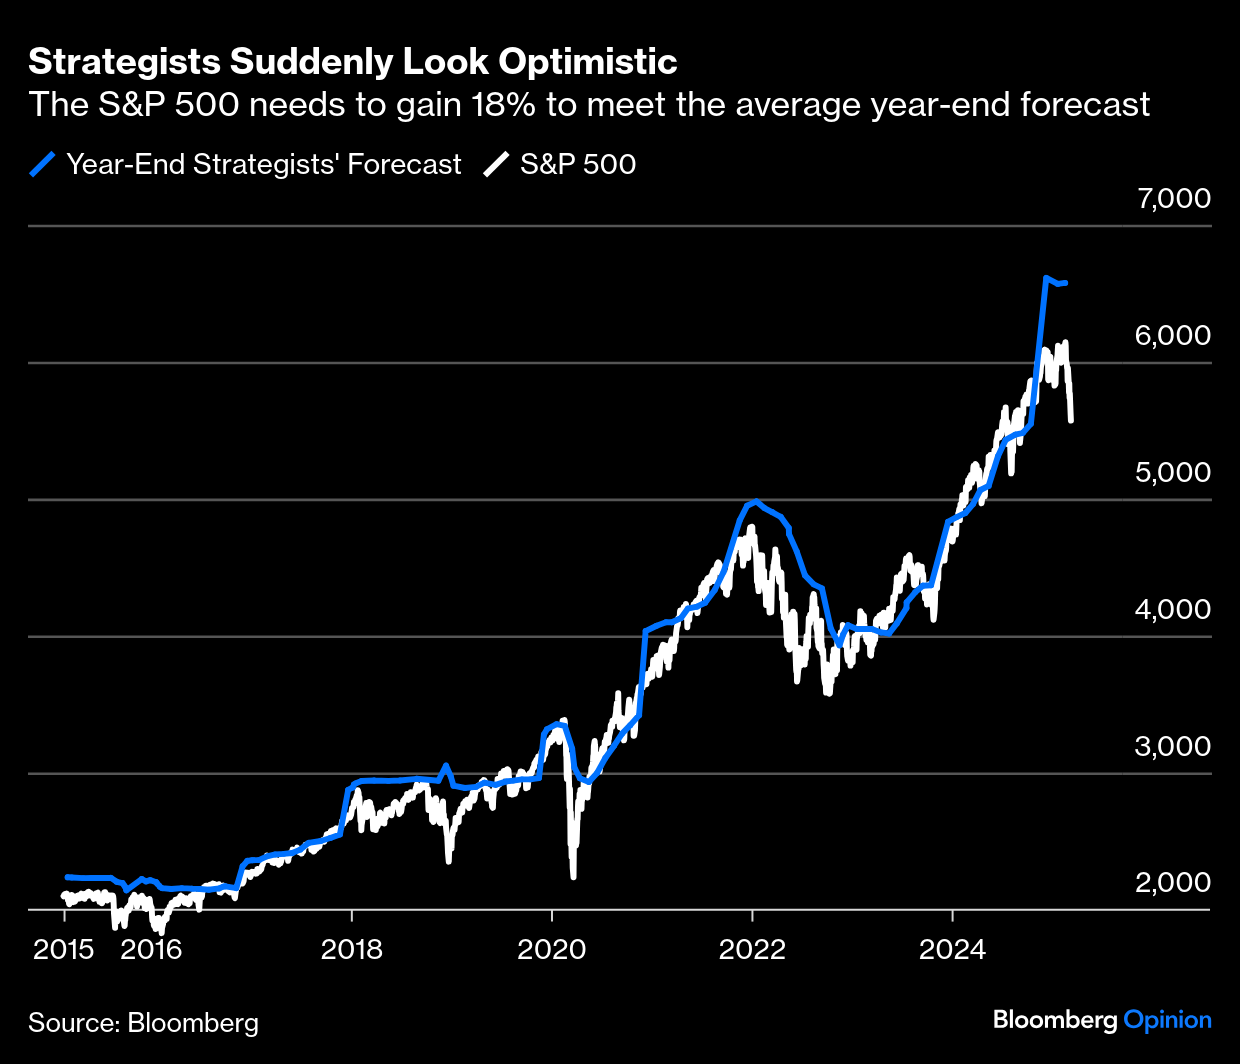 In practice, as the chart makes clear, strategists tend to mark their forecasts to market. At one level, this brings the point of the exercise into question. At another, if they’re trying to make predictions, it can only make sense to incorporate new information. The S&P’s correction is germane to the forecast. So is the raft of new policies from the Trump administration, many of them far less market-friendly than expected. The average of forecasts will be updated later in March. This week, David Kostin, chief US equity strategist at Goldman Sachs and one of the most influential voices on Wall Street, announced a revision that brings his target down from 6,500 to 6,200 — which implied an 11% rally at the time. He also reduced earnings estimates, and now expects 7% growth in profits this year, down from an original forecast of 9%. On the issue of the moment, Kostin is now assuming that the US effective tariff rate will rise by roughly 10 percentage points to 13%. “For tariffs, our rule of thumb is that every five percentage point increase in the US tariff rate reduces S&P 500 EPS by roughly 1% to 2%, assuming companies are able to pass through most of the tariffs to consumers.” Beyond the policy uncertainty around tariffs, and nerves about the economic growth outlook, Kostin also pointed to a positioning unwind, especially among hedge funds. This has indeed been spectacular. Goldman keeps a basket of stocks that are particularly important positions for hedge funds. This is how they have compared to the equal-weight S&P 500, representing the average stock, since the start of 2023: The hedgies’ picks have done very well for them, and taken the brunt of this selloff — a fact that tends to confirm that it’s also been driven by a sudden tightening of liquidity, most obviously from the rise in Japanese bonds yields, which has deprived them of a source of cheap money. Kostin makes clear that the big question is whether there will be a recession. If so — and strategists didn’t expect it three months ago — then the stock market is likely to fall further. If not, it’s still a long way to the top, but the chances are that this will turn out to be a buying opportunity: Historically, the median peak-to-trough decline in S&P 500 earnings during 12 economic downturns since WWII equals 13%. During recessions, the index level typically declines by 24% from its peak. Outside of a recession, history shows that S&P 500 drawdowns are usually good buying opportunities if the economy and earnings continue to grow, which is our base-case scenario.
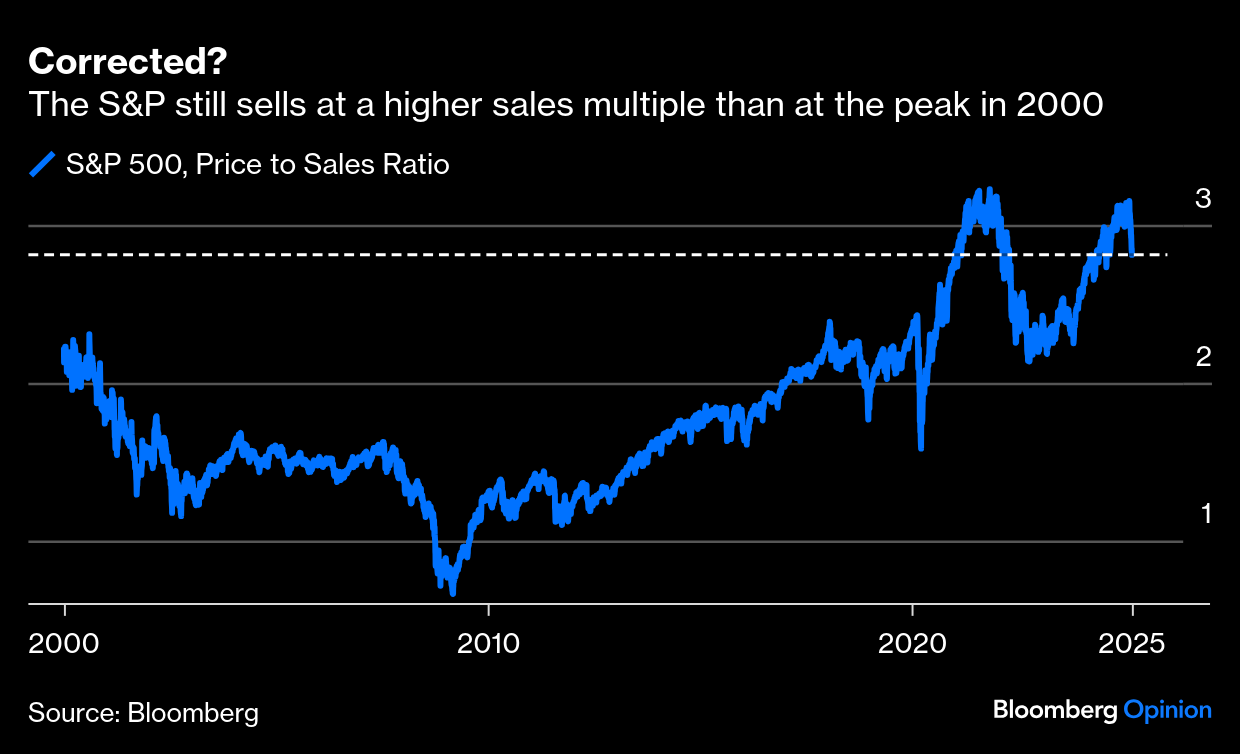
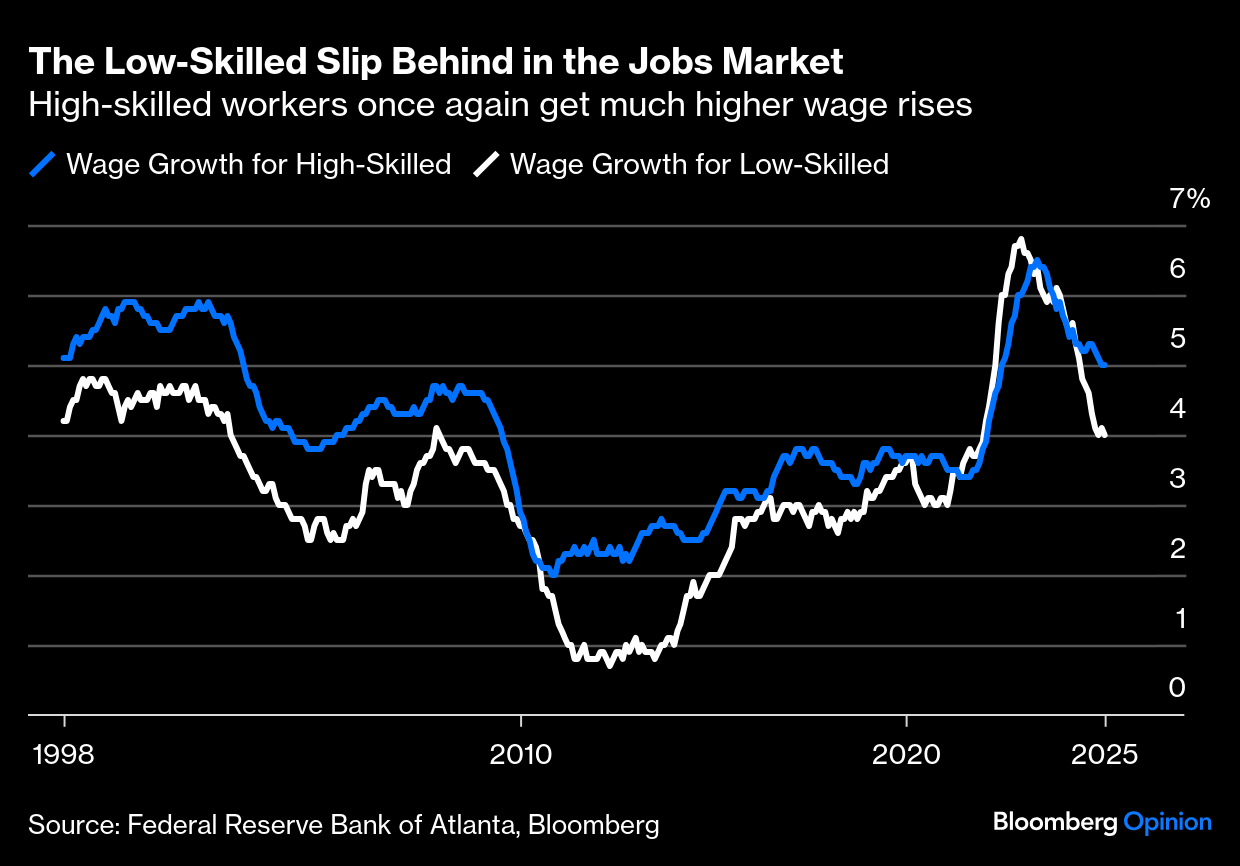
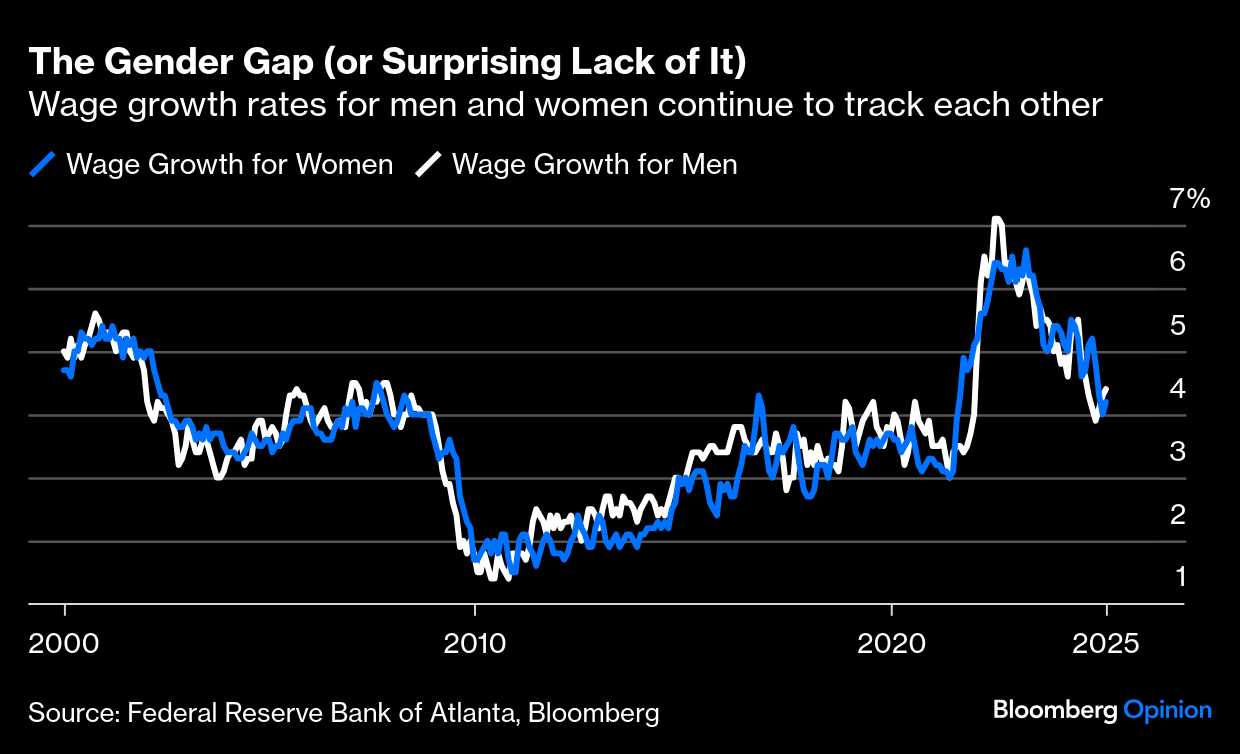
At this point, Kostin’s adjustment is a mark to market, and makes the assumption that a much more aggressive tariff policy has been priced in. The projected gain for the rest of the year is barely changed from the growth predicted from a higher base on Jan. 1. The likelihood is that other strategists will follow, and that this will dent sentiment further. And the bottom line remains the direction of the economy. It’s not a coincidence that the key for the latest leg of this selloff appears to have been President Donald Trump’s reluctance to predict that a recession would be avoided. And finally: I really dislike the word “correction,” and particularly the notion that it means a 10% fall from peak to trough. That 10% number is arbitrary. If the market was massively overvalued in the first place, a 10% drawdown won’t correct it. The word implies that the market is now correct, which is a dangerous assumption. To take one measure that admittedly makes this market look particularly expensive, the S&P 500 still trades at a higher multiple of sales than at the top of the dot-com bubble in 2000. That multiple may or may not prove to be justified, but there’s no obvious reason to believe that US stocks are now “correctly” valued: The market has fallen fast, looks oversold on many measures, and may well be ready to bounce. But we should attach minimal significance to the fact that its fall is now in double figures. It really doesn’t matter. The Jobs Market, Viewed From Atlanta | How strong is the US labor market, really? And is it contributing to higher inflation? The latest granular data suggest that it’s weakened significantly is good news for central bankers (but not for employees or governing politicians). However, the trend is not consistent. One of the most intriguing numbers comes from the wage tracker compiled by the Atlanta Fed from census data, which divides wage growth for those who stay in their jobs from those who switch. Most of the time, switchers get bigger raises — otherwise they probably wouldn’t have moved jobs. During the post-pandemic Great Resignation, the premium rose to a record. That has reversed completely, and last month job-stayers got slightly better wage growth. That’s unusual outside of recessions, and suggests workers’ bargaining power has evaporated: 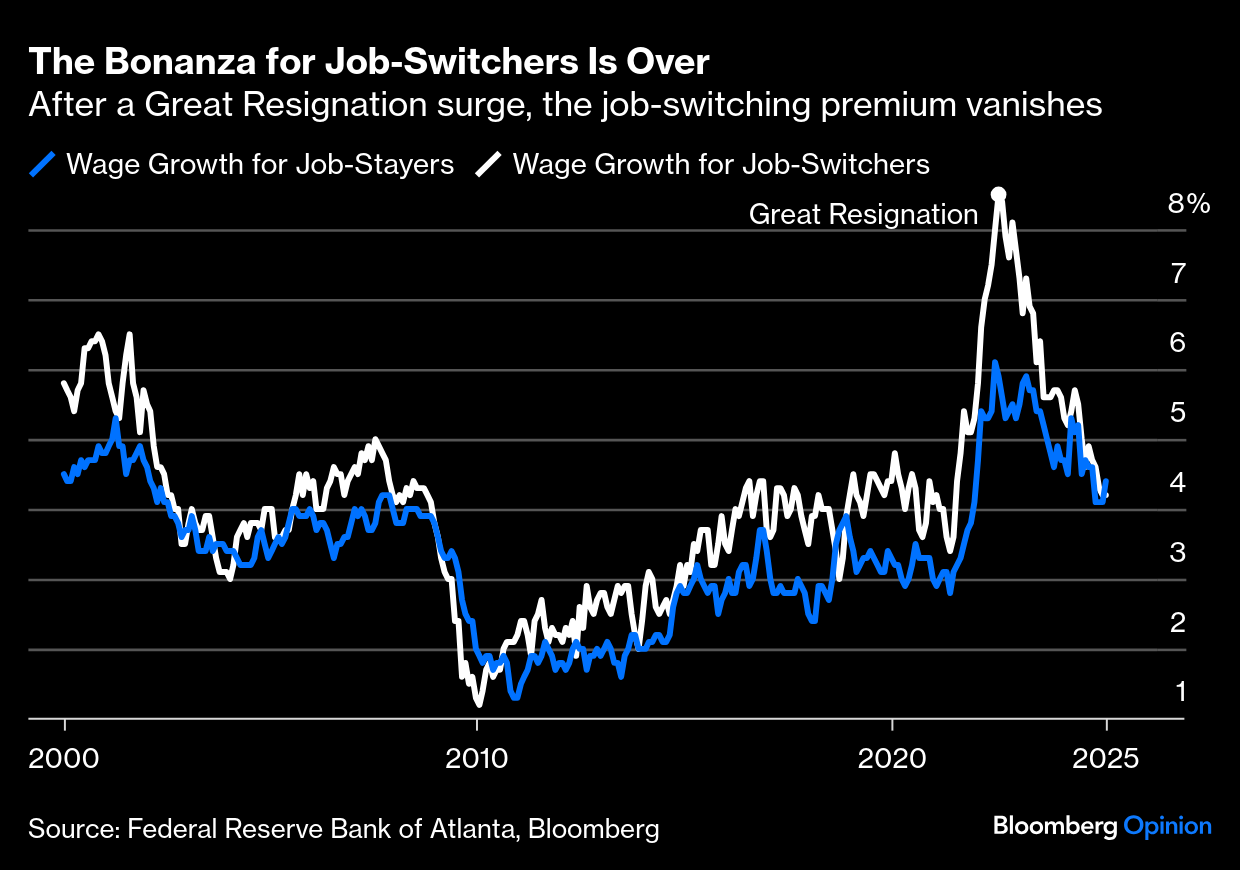 This tends to confirm the picture from the JOLTS (Jobs Openings and Labor Turnover Survey) for January. Nick Colas of DataTrek Research tracks what he calls the “Take This Job & Shove It Indicator” — the proportion of all job separations in which the worker quit. When it’s high, workers have more negotiating power than usual, and feel able to walk out on their jobs. Having reached an extreme during the Great Resignation (as also shown by the Atlanta Fed), the numbers telling their employers to shove it have dropped right back to pre-pandemic levels: 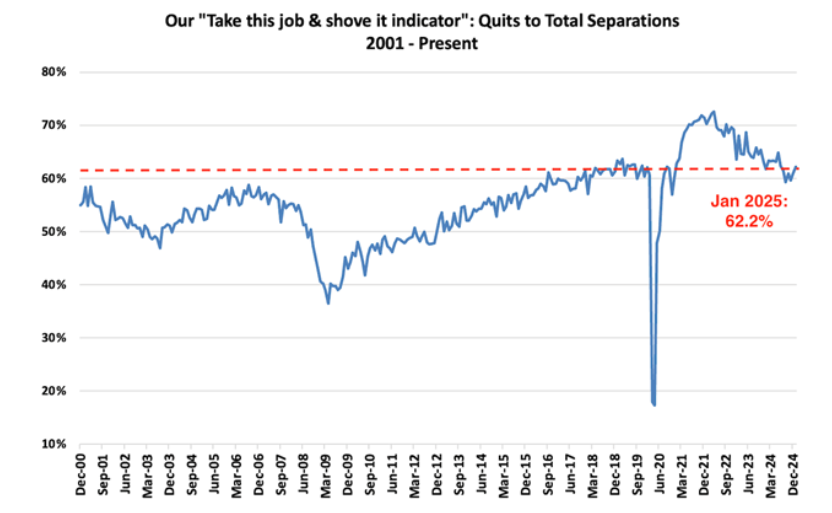 Source: DataTrek Research However, the JOLTS data isn’t as emphatic as the numbers from the Atlanta Fed. Colas concludes that workers had been slowly losing confidence, but that trend stalled last August. The current shove-it indicator is higher than at the cyclical peaks of 2001, 2005 and 2019. The Fed achieved a “soft landing” after hiking rates due to the strong post-pandemic labor market, he says, “but there is now much less of a buffer to absorb another shock. Weaker labor demand could help inflation decline even with the upward pressure of one-time tariff step-ups.” When the Atlanta Fed looked at wage growth according to workers’ level of skill, it revealed that the Robin Hood phase, when the low-skilled had actually obtained higher wages, was over. The higher-skilled are back to enjoying wage hikes a full percentage point higher: The dreadful wage growth for the low-skilled during the Obama presidency arguably had much to do with the ascendancy of President Trump, who did oversee much healthier pay rises for them. The current trend is one that he’ll want to reverse. The Atlanta Fed numbers divided by gender suggested that men have little reason to feel aggrieved — unless for some reason they think they should naturally get much higher wage growth than women. Men overtook women last month, but the story of this century has been the surprisingly narrow gender gap. Both sexes have generally enjoyed much the same wage growth: That much is encouraging. The broader picture is of a labor market that might make it easier for the central bank to ease, although the signal is not yet sufficiently clear. A latest installment in an irregular series on how pointless the Dow Jones Industrial Average is. Back in November, at the end of election week, Intel Corp., the hegemonic maker of silicon chips for many decades, was replaced in the Dow by Nvidia Corp., which has emphatically taken its crown. It’s hard to argue against the notion that Nvidia is now a far more important company than Intel. But its enshrinement in the Dow was a recognition of all the good news that brought Nvidia to its new status — and an implicit confirmation that all of that news was now in the price. Nvidia has lagged its rival badly since joining the Dow. And Intel has just had its best day in years, gaining 14% after announcing a new CEO — although both chipmakers are still down from where they were when the Dow switch happened: 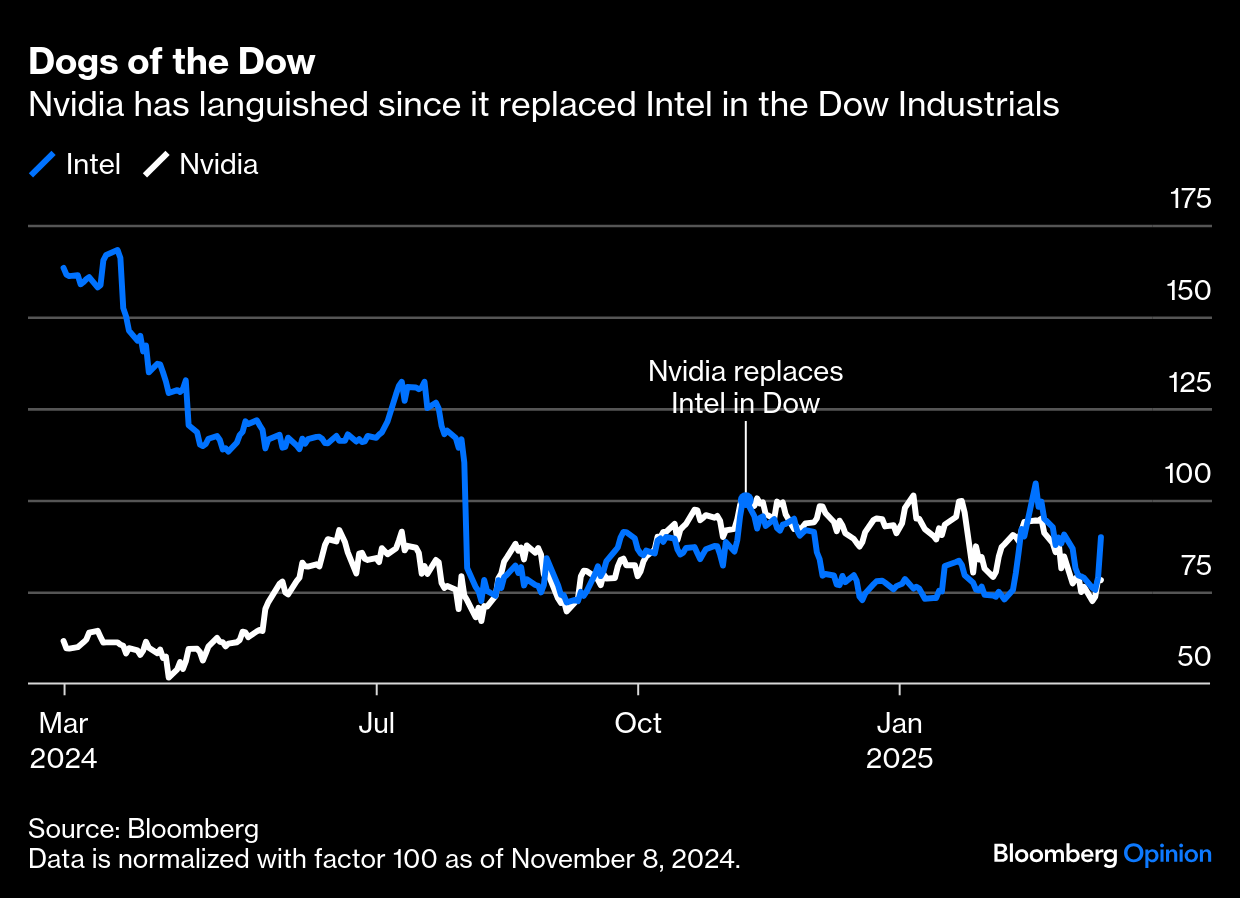 This doesn’t mean that the Dow caused Nvidia to underperform. But it does help illustrate the impossibility of maintaining an index which tries to be both concentrated and diversified. The timing is impossible. The clearest conclusion is that an index that included both Intel and Nvidia throughout would be more useful. And there are plenty of those. Points of Return has come to you from London this week. It’s a great city. In its honor, try this London play list: London Calling by The Clash, London Town by Wings, Waterloo Sunset and Muswell Hillbilly by the Kinks, Mornington Crescent by Belle and Sebastian, London Loves by Blur, West End Girls by the Pet Shop Boys, London by the Smiths, Towers of London by XTC, Tower of London by ABC, London’s Burning, also by The Clash, We Are London by Madness, South London Forever by Florence + the Machine, Up the Junction by Squeeze, Gerry Rafferty’s Baker Street, Going Underground and Down in the Tube Station at Midnight by The Jam, Sound of the Underground by Girls Aloud, Mile End by Pulp, Last Train to London by the Electric Light Orchestra, and LDN by Lily Allen. It’s time to fly home; have a great weekend everyone. Like Bloomberg's Points of Return? Subscribe for unlimited access to trusted, data-based journalism in 120 countries around the world and gain expert analysis from exclusive daily newsletters, The Bloomberg Open and The Bloomberg Close. More From Bloomberg Opinion: Want more Bloomberg Opinion? OPIN . Or you can subscribe to our daily newsletter. |